1. — INTRODUCTION
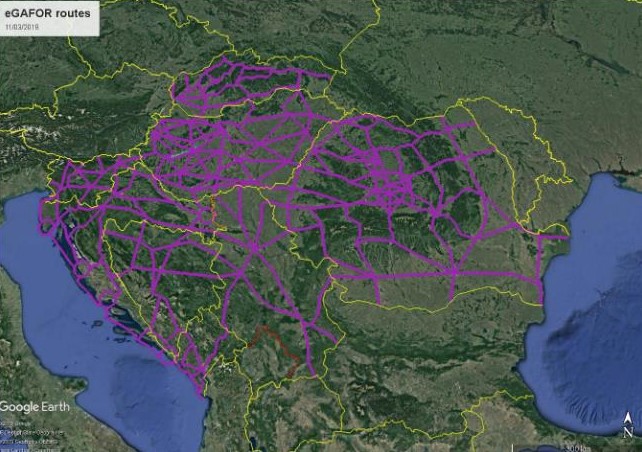
The main purpose of this AIC is to inform General Aviation (GA) pilots that from May 20th 2021 at 0001UTC the eGAFOR forecast will be provided for Bucuresti FIR, Beograd FIR, Sarajevo FIR, Zagreb FIR, Ljubljana FIR, Budapest FIR and Bratislava FIR. The eGAFOR forecast for the whole domain (in the English language) is available for users on the dedicated website https://egafor.eu The area of the continuous route network covered by the eGAFOR forecast is given in the figure below. The eGAFOR routes are harmonized and connected at cross border points.
The eGAFOR forecasts for specific FIRs will be created by the MET providers as shown in the table below.
| FIR | MET PROVIDER |
| Beograd FIR | SMATSA Llc |
| Bratislava FIR | SHMÚ |
| Bucuresti FIR | ROMATSA |
| Budapest FIR | OMSZ |
| Ljubljana FIR | ARSO |
| Sarajevo FIR | BHANSA |
| Zagreb FIR | Croatia Control |
2. — OBJECTIVE
The eGAFOR forecast is a uniform, harmonized, probabilistic, graphical, colour-coded Low Level Forecast (LLF) for VFR Flights up to FL100, with an assessment of the impact of MET phenomena on flight routes.
3. — APPLICABILITY
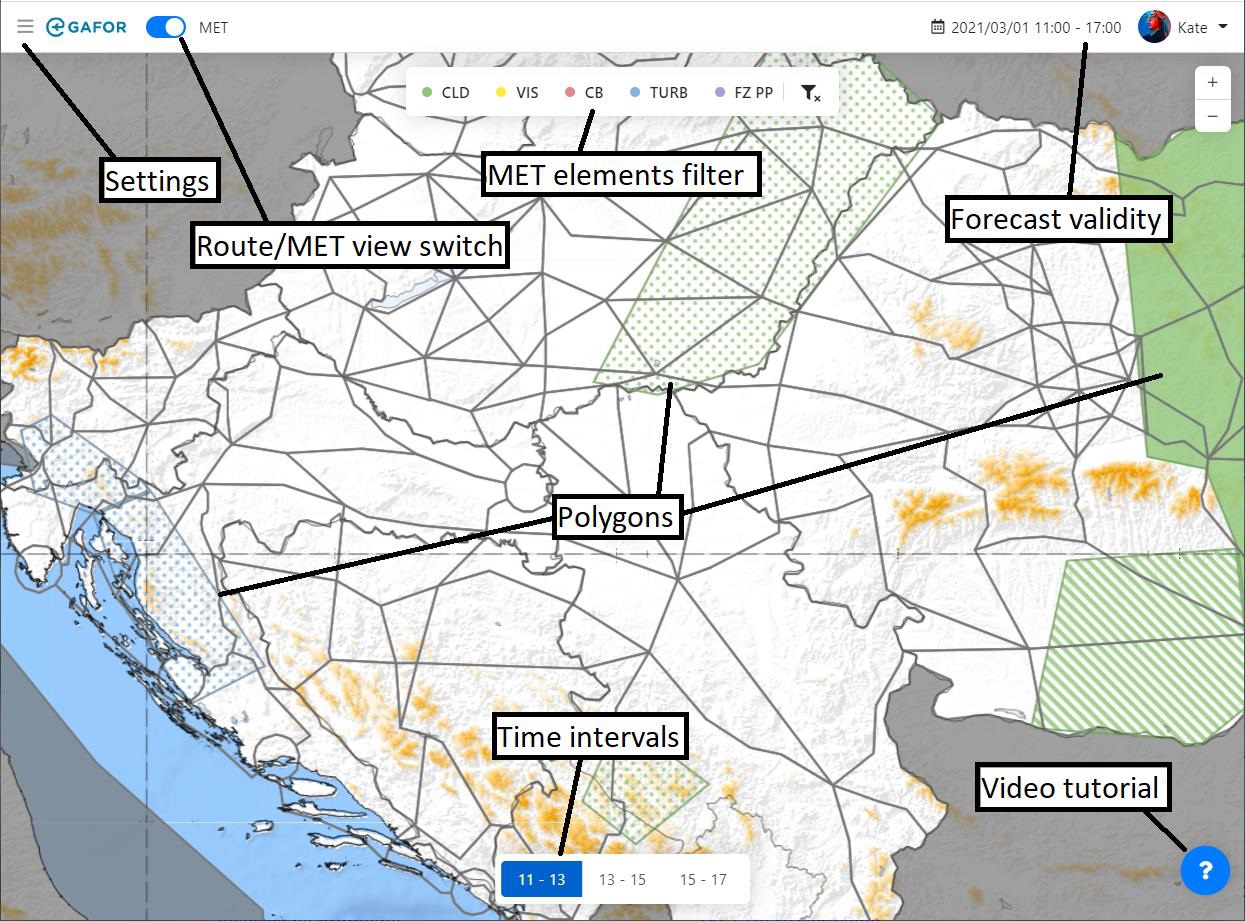
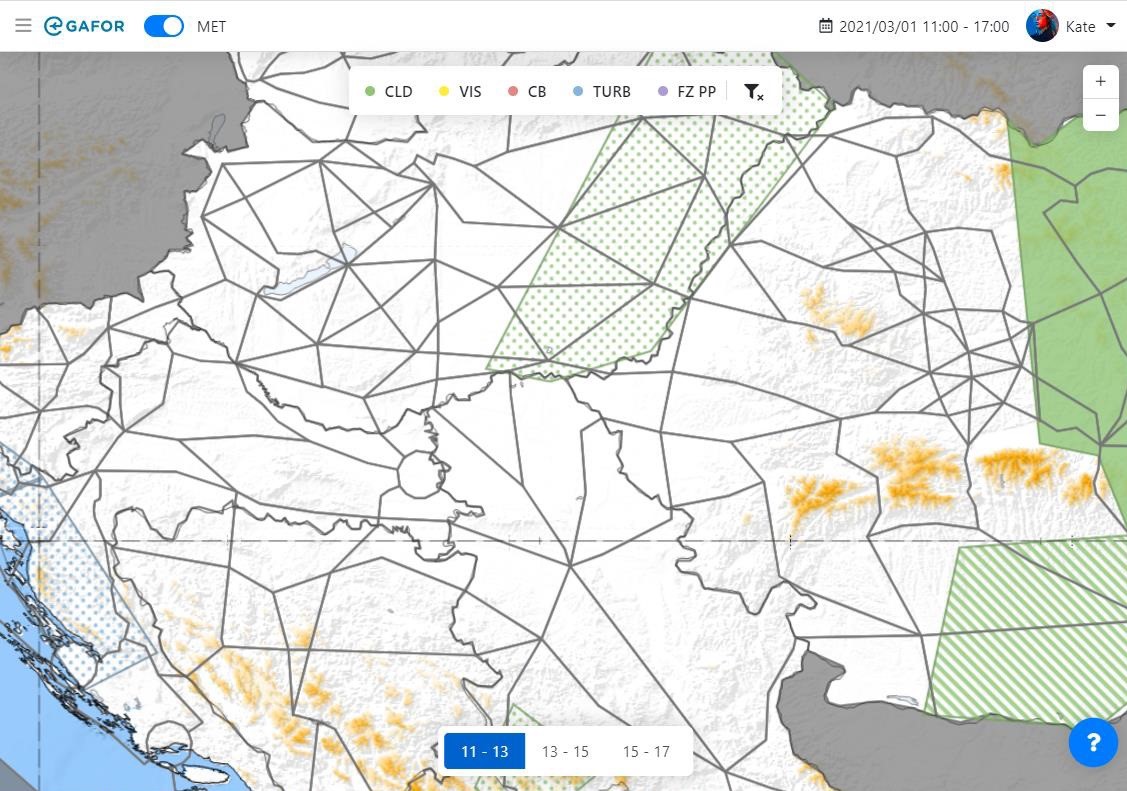
The eGAFOR Viewer is a web-based software that enables users to see the product. They can view the route status, check different forecast intervals, view more detailed MET information (the polygons of significant weather phenomena), and even change some of the viewing settings when registered and logged in. It can be viewed on mobile devices, as well as on desktop devices. On the eGAFOR Viewer start page, the login section is displayed
Users can sign in by using their Google Account without needing to register or they can proceed as a guest. eGAFOR will display the colour-coded state of the routes (Route View) or polygons of significant weather phenomena (MET View). Users can choose between Route View and MET View on the MET switch. After clicking the question mark button at the right bottom corner, users will be redirected to a page that includes a video tutorial for using the eGAFOR Viewer.
4. — TIME OF ISSUE AND VALIDITY PERIOD
The validity time of the eGAFOR forecast is 6 hours and it is divided into three 2-hourly intervals. Each polygon refers to a 2-hourly interval. The time of issuance, validity period and 2-hourly intervals are given in the table below.
| Issuance time (UTC) | Validity period(UTC) |
| 1. time interval | 2. time interval | 3. time interval |
| 0200 | 03-05 | 05-07 | 07-09 |
| 0600 | 07-09 | 09-11 | 11-13 |
| 1000 | 11-13 | 13-15 | 15-17 |
| 1400 | 15-17 | 17-19 | 19-21 |
By clicking the time buttons at the bottom of the display, users can choose the time intervals of the forecast. Whenever the eGAFOR forecast is updated a notification “The forecast is updated” pops up and the updated forecast is displayed. Depending on the duration of the illuminated part of the day not all time intervals of the eGAFOR forecast may be issued. If a forecast has not been issued for a specific time or due to technical reasons, the whole area of the responsibility of a certain provider (e.g. FIR) will be greyed-out for the selected time interval.
5. — CONTENT OF THE eGAFOR FORECAST
The listed weather phenomena hazardous for aviation are included in the eGAFOR forecast as polygons with different colors:
| Phenomena | Acronym | Explanation | Polygon color |
| BKN/OVC clouds | CLD | Cloudiness coverage more than 4/8 | Green |
| Visibility | VIS | Horizontal visibility on the ground level below 8km | Yellow |
| Cumulonimbus clouds | CB | Horizontal distribution of CB clouds | Red |
| Turbulence | TURB | Turbulence in Low Level Flight altitudes | Blue |
| Freezing precipitation | FZ PP | Any precipitation which freezes on contact with surfaces | Purple |
The meteorological forecast translated into impact (state of the route) is shown in traffic light colors.
| RED | Closed |
| ORANGE | Marginal conditions, not suitable for standard VFR operations, high level risk for aircrew under VFR conditions (high level of skills and knowledge of local conditions and terrain is a prerequisite) |
| YELLOW | Difficult weather condition for VFR operations (high level of skills and knowledge of local conditions is a prerequisite) |
| GREEN | Open |
The eGAFOR route is a smooth stripe 1200m wide that follows the terrain. Each route has its reference height, which is the altitude of the highest geographical obstacle on the route. Reference altitudes are rounded-up to 100ft. Three probability classes are used for each forecasted MET phenomenon
| LOW | 0 - 30% |
| MEDIUM (MED) | 30-70% |
| HIGH | 70-100% |
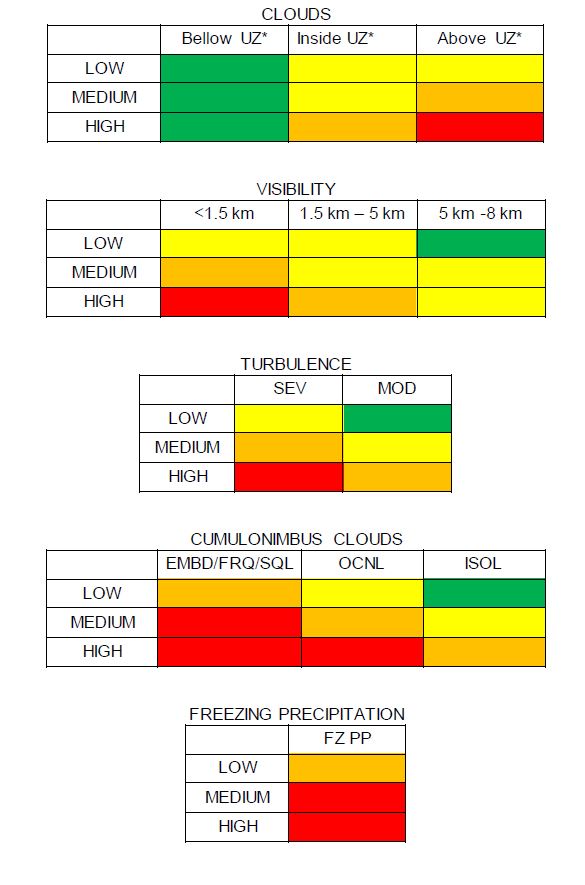
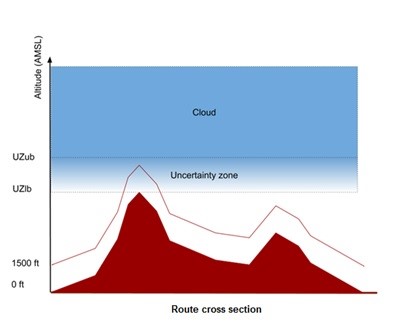
For each interval of the eGAFOR forecast, the MET phenomenon is displayed as a polygon defined by the probability of occurrence and severity or category of the phenomenon. If a MET phenomenon is not forecasted in the time interval, or if it is not significant, no corresponding polygon is displayed. CLOUDS are forecasted as a polygon with a relatively uniform cloud base. Cloud base height is given in ft AMSL and the vertical step is 100 ft. Due to the impossibility of determining the exact cloud base, an uncertainty zone has been introduced. The Uncertainty zone (UZ) is a zone between the minimal and maximal value of the forecasted cloud base. Route impact is determined by subtracting ground elevation and 1500 ft from the upper (UZub) and lower (UZlb) boundary of the uncertainty zone over the area of the CLD polygon along the route cross-section depending on the polygon's probability class, as shown in the figure below and table CLOUDS. Registered users can modify the 1500ft threshold but only to values above 500ft.
VISIBILITY is forecasted in three classes:
- Below 1.5km
- Between 1.5 and 5km
- Between 5 and 8km
TURBULENCE is forecasted in two severity classes and vertical extent is given in ft AMSL. The step for vertical extent is 1000ft:
- MOD e.g. moderate
- SEV e.g. severe
CB distribution is forecasted in three classes: ISOL OCNL EMBD/FRQ/SQL CB implies TS, GR, MOD or SEV TURB, ICE. FREEZING PRECIPITATION is forecasted any precipitation which freezes on contact with surfaces.
The relations between forecasted MET elements and their impact on the route are shown in the tables below:
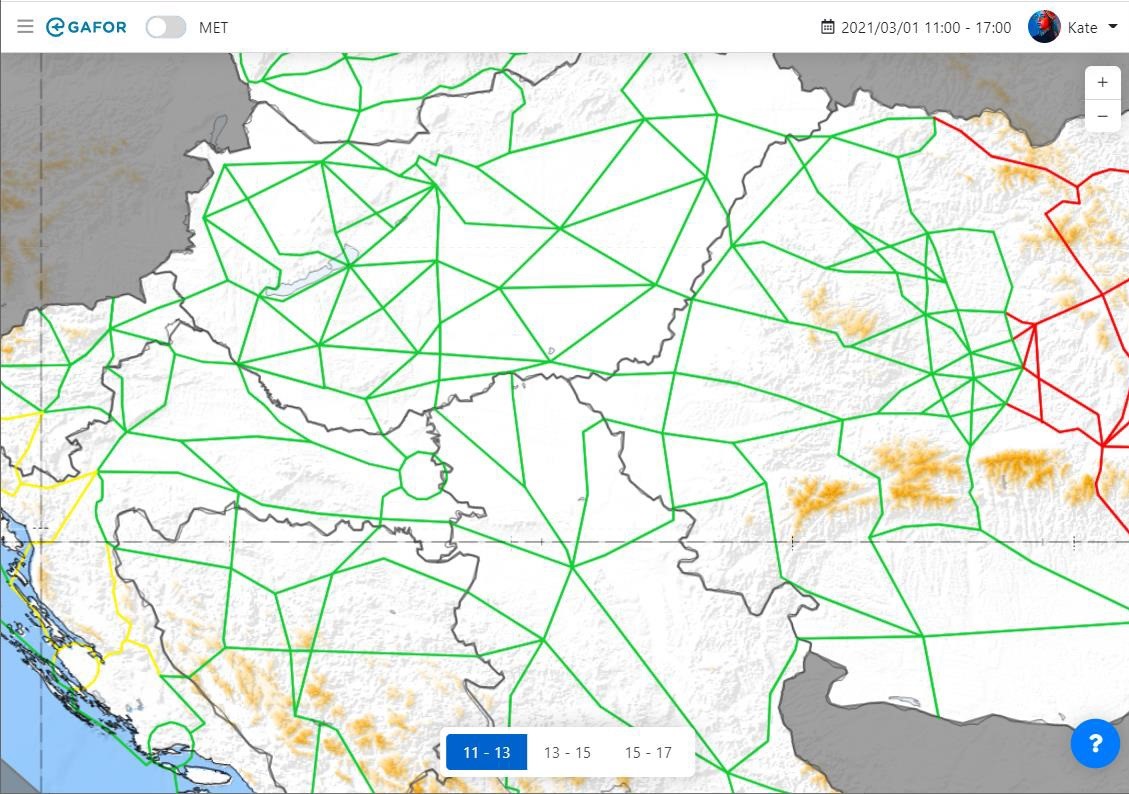
5.1 ROUTE VIEW
When the MET switch is off, the route network is displayed, showing the eGAFOR forecast translated to impact on the individual routes. By clicking on the route, the route is indicated as a dashed line. A pop-up box is displayed with a description of the type of polygon (vertical stripe on the left), the probability and other properties of the polygon affecting the route. If part of the route is affected by the polygon, the state of the whole route is changed under the impact of the polygon.
In the settings, registered users can filter-out phenomena for which impact will be displayed and change the default CLD threshold value to values not lower than 500ft. If the impact on the route is red, it is always displayed even if the switch for the impact of the associated phenomenon is off.
5.2 MET VIEW
When the MET switch is on and no selection is made the forecasted polygons are displayed. The colour of the polygons indicates polygon type and the fill style of the polygon indicates impact type. Solid fill indicates red impact, stripes indicate orange impact and dots indicate yellow impact. It is also possible to use the filter bar to see only polygons of a certain phenomenon. By clicking inside the polygon area in MET View, a label pops up with polygon properties.